Since the end of the financial crisis, or better yet, the market bottom in March 2009, weekly market declines for the S&P 500 Index lasting four consecutive weeks or longer have been a somewhat rare occurrence. The most recent string of four consecutive weekly declines occurred the week of September 22, 2014 through the week of October 13, 2014. Prior to this 2014 four week decline, the last string of four consecutive weekly declines occurred in 2011 (7/25/2011 - 8/15/2011). Since the beginning of 1990, the market has experienced a total of 22 time periods, out of 1,306 weeks, where the S&P 500 Index declined for four or more consecutive weeks.
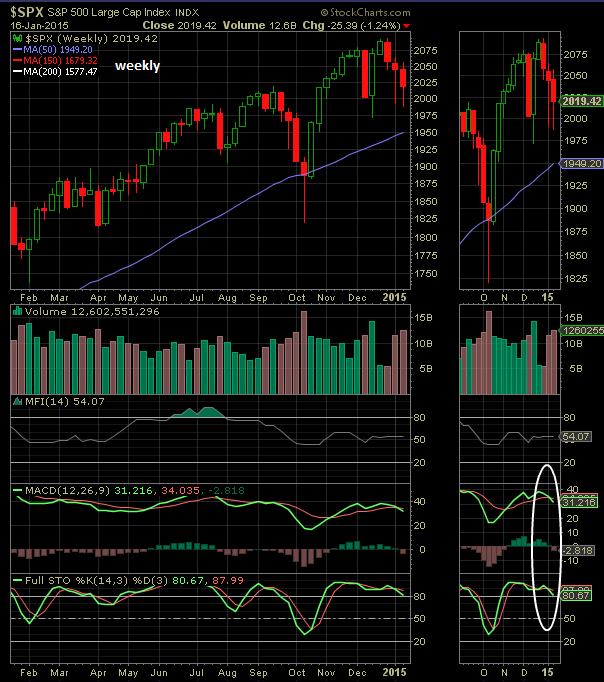
Last week the market fell 1.24% and this was the third weekly decline for the S&P 500 Index. As the below chart shows, the technical set up for the weekly chart for the S&P 500 Index is suggestive of potential market weakness in the coming week with a negative MACD indicator and a negative stochastic indicator.
Read More.... Click Here / http://trade4x.net/
No comments:
Post a Comment